Searching for maps identifying sources of water pollution in the United States through Google searches on Chrome, the first four relevant results were the following:
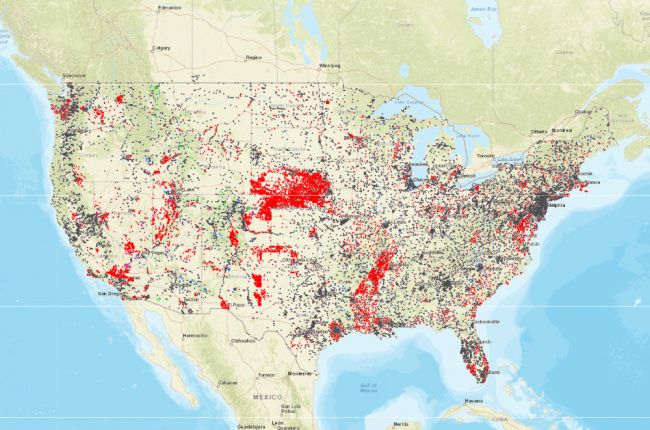
USGS Interactive Map – 40 Years of Water-Quality Data
This U.S. Geological Survey interactive map provides a comprehensive, long-term look at changes in the quality of our nation’s rivers and streams over the last four decades. For the first time, monitoring data collected by the USGS and 73 other organizations at almost 1,400 sites have been combined to provide a nationwide look at changes in the quality of our rivers and streams between the 1972 passage of the Clean Water Act and 2012.
The interactive map can be used to see whether 51 water-quality constituents, like nutrients and pesticides, and 38 aquatic-life metrics, like the types and numbers of fish, macroinvertebrates, and algae, have increased, decreased, or remained the same at nearly 1,400 sites between 1972 and 2012. For example, the phaseout of the insecticide diazinon for residential and some agricultural uses was initiated in 2000 and has led to widespread reductions in concentrations in U.S. streams, which can be seen on the map during the trend period from 2002 to 2012.

USGS – 38 Maps of Water Sources – The Water Resources Mission Area
The Water Resources Mission Area creates a wide variety of spatial products from GIS datasets, online mappers and decision-support tools, data visualizations, and traditional static maps, including maps of concentrations of dissolved solids by regional variation in streams across the Nation.

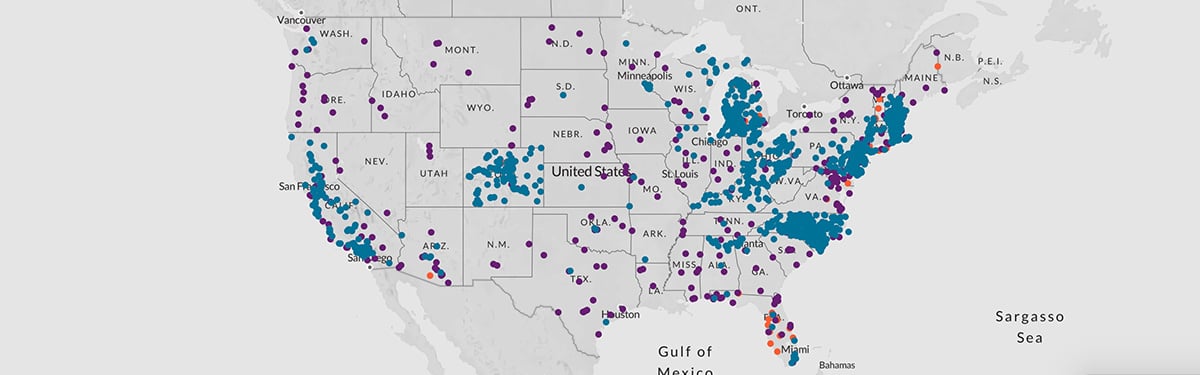
EWG’s Map of the PFAS Contamination Crisis
The Environmental Working Group is a non-profit, non-partisan organization dedicated to protecting human health and the environment. This EWG map shows the extent of American communities’ confirmed contamination with the highly toxic fluorinated compounds known as PFAS continues to grow at an alarming rate. As of January 2021, 2,337 locations in 49 states are known to have PFAS contamination.
AGI’s Interactive map of water quality at the state and local level
AGI, The American Geosciences Institute, represents and serves the geoscience community by providing collaborative leadership and information to connect Earth, science, and people.
The U.S. Geological Survey’s National Water Information System (NWIS) created an interactive tool that maps water resources data at over 1.5 million sites across the country. The search tool allows the user to find sites by street address, location name, site number, state/territory, and watershed region. The sites are sorted into five main categories:
Surface water, including lakes, streams and rivers
Groundwater, including wells
Springs
Atmospheric
Other, which includes land sites
Sites within the categories listed above can be narrowed further through the type of data that are available at each site. The data categories include:
Any data
Instantaneous data
Water-quality data
Peak data
Measurements
Annual Report